
- Bitcoin has undergone a strong rejection over the past two days.
- The coin dropped from the $11,200 highs it was trading at just days ago to a recent low around $10,200 on Coinbase.
- BTC now trades for $10,450, having slightly bounced in tandem with other legacy markets.
- Bitcoin’s Monday drawdown came as the S&P 500 fell over 2.5% during the session lows and as the U.S. dollar jumped.
- Despite uncertainity about BTC’s price action in the near term, one analyst believes that the long-term chart is bullish.
- One trader pointed out that since Bitcoin bounced cleanly off the low-$10,000s, the drop was just a bullish retest.
- The $10,000s have long acted as a crucial level for Bitcoin’s trend, marking the
Bitcoin’s Recent Drop Wasn’t Entirely Bearish: Here’s Why
Bitcoin has undergone a strong drop over the past 24 hours due to weakness in legacy markets. From last week’s highs, the coin has shed around $1,000, falling from the highs at $11,200 to a local low at $10,200.
With Bitcoin bouncing from those lows, analysts are actually somewhat optimistic about BTC’s prospects.
One chartist shared the below chart on September 21st in the wake of the drop. He stated that due to Bitcoin’s rapid recovery from the local lows, it can be said that the drop was actually just a bullish retest of the crucial horizontal zone in the vicinity of $10,000. He elaborated:
“$BTC – nothing but a bullish retest for now. Bulls want to reclaim $11.2k. Bears want to see price below $10.2k. Bought dips across the board in anticipation of at least a bounce.”
This came after a number of other commentators noted that Bitcoin’s recent drop actually formed a higher low on a medium-term time frame. This higher low suggests that an uptrend may be forming, not a downtrend as some investors have explained.
Chart of BTC's price action over the past year and so with analysis by crypto trader HornHairs (@Cryptohornhairs on Twitter). Chart from TradingView.com
Bear Trend Could Soon Reverse
There are signs that the bear trend could soon reverse to the upside.
Crypto fund manager and analyst Mohit Sorout shared the chart below after the drop as reported by Bitcoinist previously. The chart shows that a key trend indicator that last flashed a buy signal prior to Bitcoin’s $2,500 rally around six weeks ago has returned.
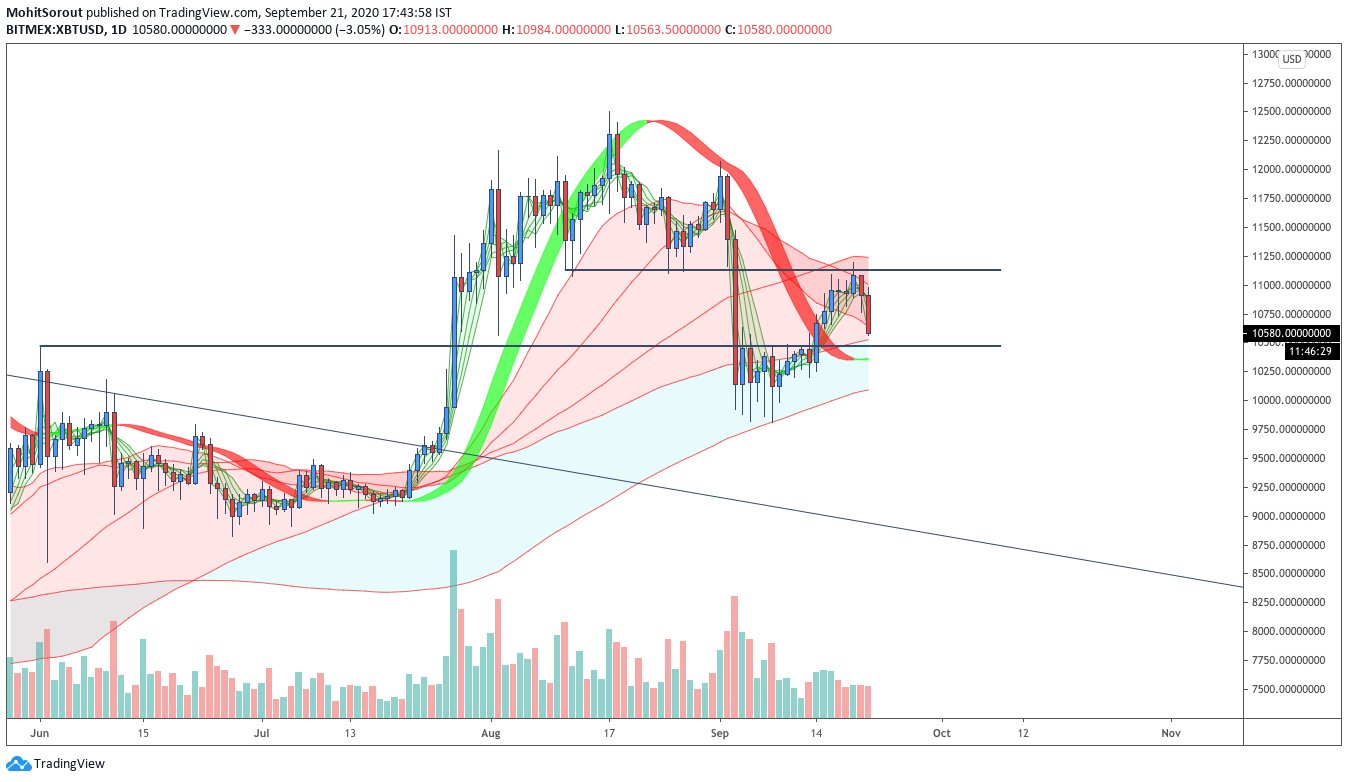
Chart of BTC's price action over the past few weeks with analysis by crypto trader and fund manager Mohit Sorout (@Singhsoro on Twitter).
Chart from TradingView.com
Also corrobrating the expectations of a return higher are fundamental trends such as the continued injection of stimulus and simultaneous accumulation of BTC that will likely drive prices higher over time.
Featurd Image from Shutterstock
Price tags: xbtusd, btcusd, btcusdt
Charts from TradingView.com
Here's Why Bitcoin's Recent $1,000 Drawdown Isn't Entirely Bearish
Crypto Sol recommends CEX.io for the best rates for cryptocurrency trading.